

Project KPI Dashboard: Why Real-Time Project Monitoring Determines Success or Failure
Why a project KPI dashboard determines project success or failure. All 12 widgets explained: what they measure, why they matter, CPI, SPI, Earned Value, Forecast, Margin.

Margin Δ Forecast vs. Budget: Is Your Project Becoming More or Less Profitable Than Planned?
A positive deviation means the project will earn more profit than estimated. A negative deviation means the project is burning margin — and if you do not notice it now, you will notice it at project close, when it is too late.

Budget Margin: The Reference Point for Profitable Project Estimation
Without a clear profitability target from the original estimate, any later variance analysis is meaningless. The Budget Margin (D.3) is exactly that target: it defines how much profit a project should generate when all tasks are completed within the planned hours and with the assigned staff.

Forecast Margin: Do You Already Know What Your Project Will Earn at the End?
Most project leaders only find out whether a project was truly profitable after it closes. By that point, all the decisions have already been made — resources are committed, invoices sent, opportunities missed.
Actual Margin: What Your Project Is Really Earning Today
Most projects are managed by hours consumed or budget burned — rarely by the metric that truly matters: the actual contribution margin. The Actual Margin (D.1) closes that gap. It shows, to the cent, how profitable your project is right now — not at final billing, but while work is still in progress.
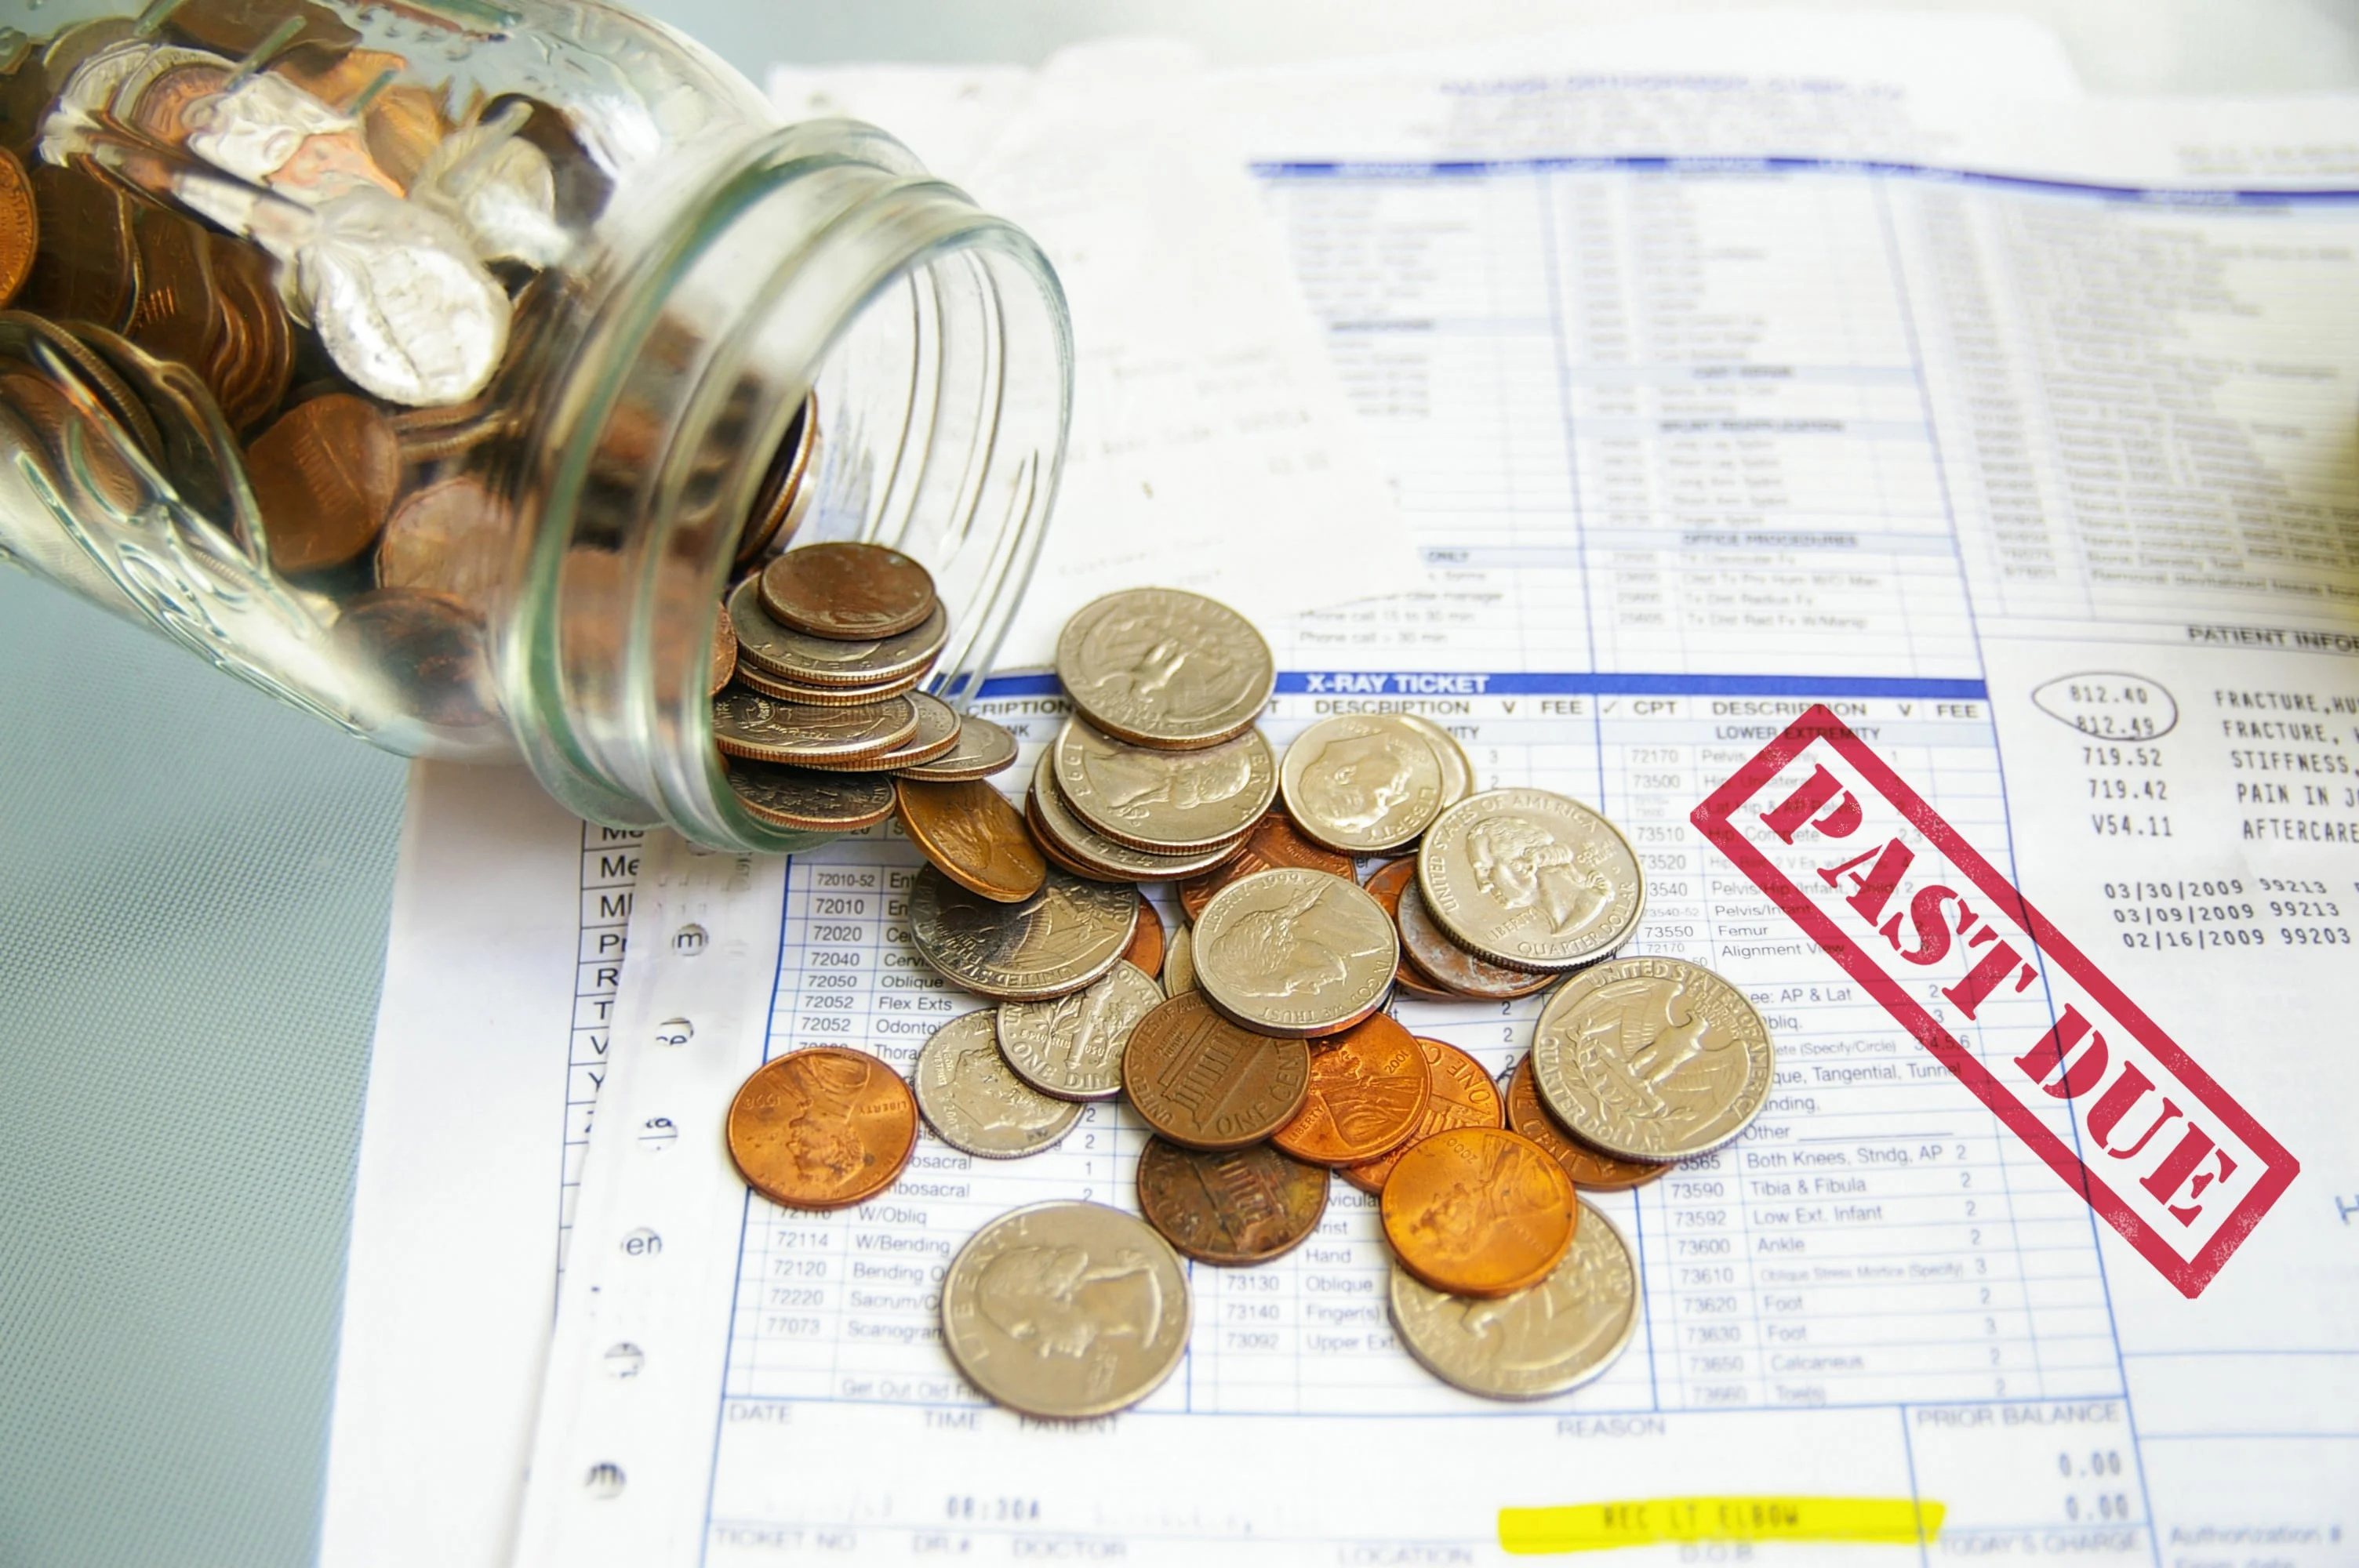
Unbilled (€): Why Uninvoiced Work Is Your Biggest Liquidity Risk
There is a category of business risk that is particularly deceptive: the kind you cannot see. Unbilled work falls squarely in that category. The project runs, the team works, costs accrue — but the money is not arriving yet.
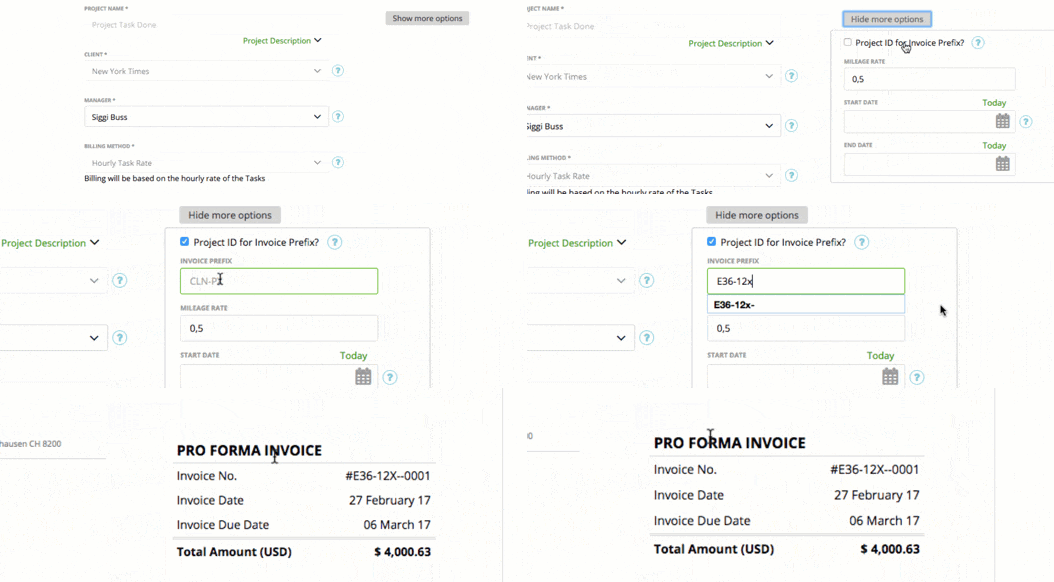
Billed (€): Do You Know How Much of Your Project Work Has Already Been Invoiced?
Projects run, hours get logged, work gets delivered. But not every delivered service is a paid service — because between the moment work is performed and the moment an invoice reaches a client, a great deal of time can pass.

Forecast (EAC) Cost: What Will Your Project Actually Cost to Complete?
Estimating project costs is one thing. Knowing what a project will actually cost at completion — based on current efficiency, using each team member’s real cost rate — is something else entirely.

Forecast (EAC) Hours: How Many Hours Will Your Project Actually Take to Complete?
Project budgets rarely collapse in a single moment. They erode hour by hour — until the end of the project reveals a shortfall that could have been spotted weeks earlier. The Forecast (EAC) Hours KPI makes exactly that possible: a reliable projection of total hours based on real project data, not gut feeling.

Progress (Earned Value): Real Progress Instead of Perceived Progress
“The project is 50% complete” — this statement sounds reassuring. But what does it actually mean? Have you consumed 50% of planned hours? Has 50% of the time elapsed? Or has 50% of the work genuinely been finished?

Actual Cost (€): What Your Project Really Costs — Down to the Last Euro
The most common source of project cost errors is not lack of diligence — it is lack of methodological precision. Anyone who calculates personnel costs using a flat hourly rate is working with an approximation, not reality.
Budget Usage (h): How Much of Your Project Hour Budget Has Been Consumed?
Managing a project without tracking hour consumption is like driving without looking at the speedometer. You might reach the destination — or you might not. The Budget Usage (h) metric shows you in real time how much of your planned hour budget has already been consumed.
One tool, everything under control
Boost employee satisfaction, productivity and loyalty. Work is no longer a place. Work is whenever your employees feel productive and give their best.
Try it now for free!